
 Reports & exports
Reports your accountant will actually use
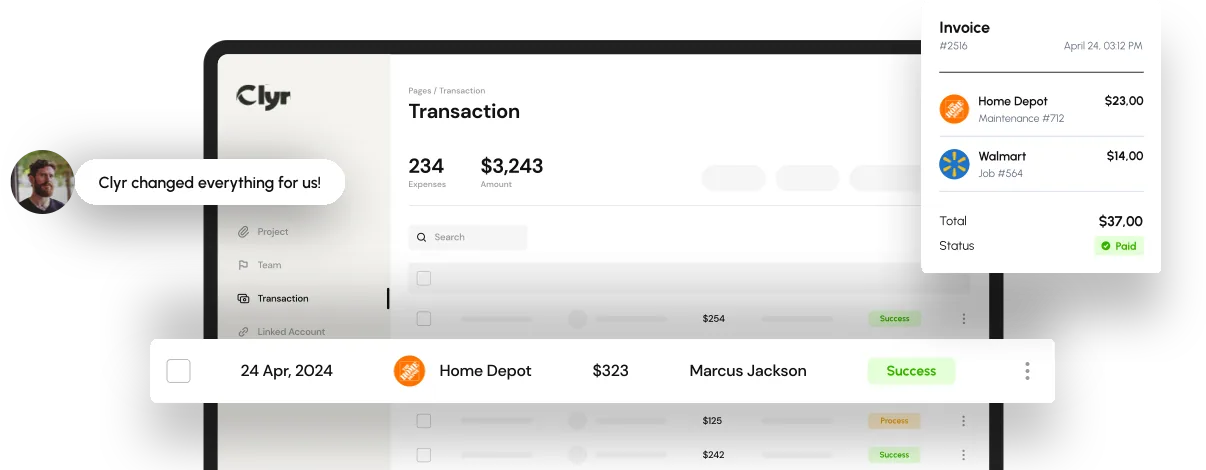
Slice spend by job, property, GL account, vendor, department, or any custom field. Then export it to Excel with every receipt behind it, or share a live view-only link.
 What you get with Clyr
One builder, two buttons, zero spreadsheet assembly

A real report builder
Filter by job, team member, category, merchant, or date. Card spend, reimbursements, and vendor bills in one report, because they live in one system.

Exports that close the books
One click for the Excel file, one click for a PDF of every receipt behind it. Your accountant gets the numbers and the paper trail together.

A live view between closes
Save a report, name it, and share a link anyone can open without touching your setup.
The builderA report builder that speaks your coding
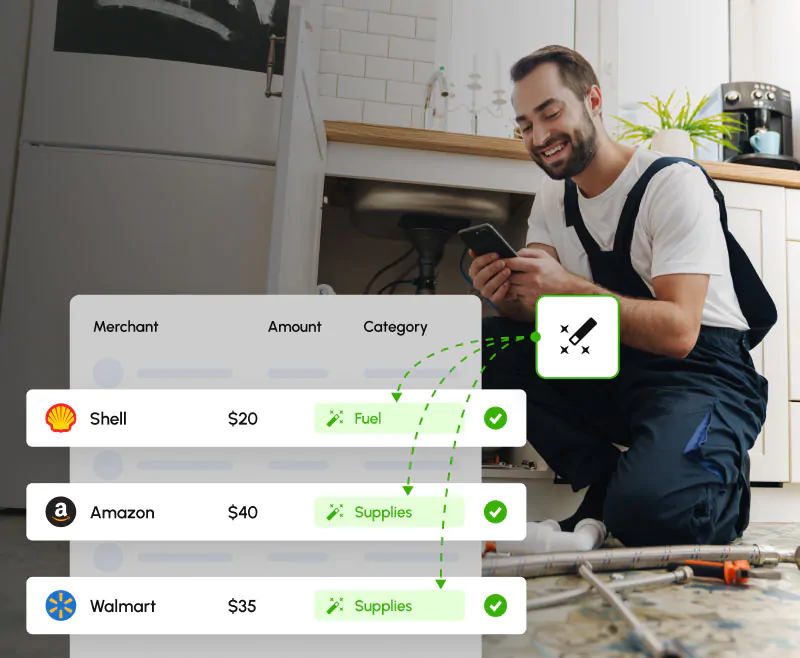
Generic expense reports slice by merchant category, which tells a contractor nothing. Clyr reports run on the coding your business actually uses: jobs, properties, units, cost codes, GL accounts, classes, departments, and any custom field you have defined.
The question “what did we spend on materials for the Hendricks job” becomes a filter, not a project.
Pick the dimension, pick the date range, and the report is built from the same coded transactions your team captured in the field. Because Clyr holds card spend, employee reimbursements, and vendor bills in one place, one report can answer questions three systems used to fight over.
 Exports
Exactly what your accountant receives
No more shoebox with better lighting. When the report is right, two buttons finish the job.
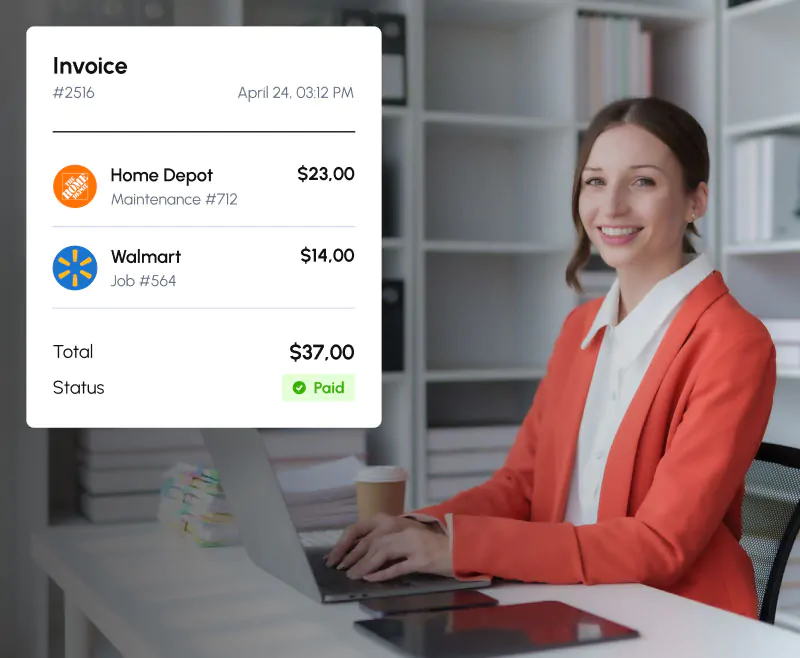
Saves the report data as an Excel file, sliced exactly as you filtered it.
Produces a single PDF containing every uploaded receipt behind the report, so an auditor or owner can see the document behind any line.
 Saved reports & sharing
Build it once, run it every month
Named, saved, rerun on demand
Name a report, keep it, and rerun it whenever you need it, so a monthly job cost summary is one click instead of a rebuild.
Share by link, view-only
Send a link and the recipient sees the report in view-only mode. They can adjust the date range, and nothing else, so your accountant checks the month without anyone touching your filters or your books.
 Between closes
Dashboards between reporting cycles
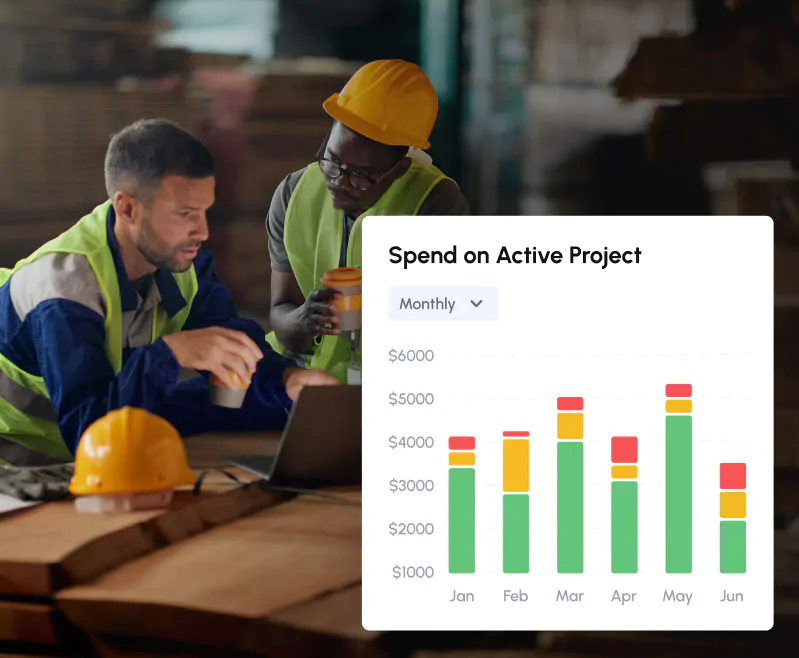
Reports answer questions you ask; dashboards answer the ones you should be asking. The overview dashboard keeps daily spend visible between closes, so month-end becomes a confirmation of what you already knew.
For anomaly alerts and daily signals, see Spend Insights →
FAQDirect answers, no dodging
Can I report by property or job?
Yes. Jobs, properties, units, cost codes, GL accounts, classes, departments, team members, merchants, and custom fields are all reporting dimensions.
Do exports include receipt images?
Yes. “Download Receipts” produces one PDF containing every uploaded receipt behind the report, alongside the Excel data export.
Can I save a report and run it again?
Yes. Reports save with custom names and rerun on demand, so recurring views like monthly job cost summaries are one click.
Can I share a report with my accountant?
Yes, by link. Recipients get view-only access and can change only the date filter. No extra seat required.
What formats do exports come in?
Excel for the report data, PDF for the receipt bundle.
What date ranges can I run?
Presets for 7 days, 30 days, 1 year, and all time, plus any manual date range.
Does reporting cover bills and reimbursements too?
Yes. Card expenses, employee reimbursements, and accounts payable all feed the same report builder.
Get a demoSee it on your own spend
Book a 20-minute demo. Bring a recent card statement; we will build the report your accountant keeps asking for, live, on your numbers.